Image files
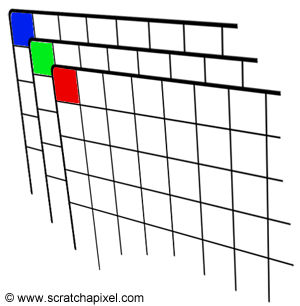 There are many different formats to store images. Some store the information about the color of every pixel ("picture element" or dot on the screen). Others store end points of lines or boundaries of regions and the colors of each. We focus on the former, and in particular, use the png (portable network graphics) file format, which is popular for storing images captured from cameras and is `lossless' (every pixel captured is stored, so, can also be quite large). Each pixel is represented by its the percentage of red, green, and blue ("RGB") values. Images are stored as a grid of red values, a grid of green values, and a grid of blue
values (an optional fourth grid can hold the alpha or opacity channel).
There are many different formats to store images. Some store the information about the color of every pixel ("picture element" or dot on the screen). Others store end points of lines or boundaries of regions and the colors of each. We focus on the former, and in particular, use the png (portable network graphics) file format, which is popular for storing images captured from cameras and is `lossless' (every pixel captured is stored, so, can also be quite large). Each pixel is represented by its the percentage of red, green, and blue ("RGB") values. Images are stored as a grid of red values, a grid of green values, and a grid of blue
values (an optional fourth grid can hold the alpha or opacity channel).
For example, if we stored our image in the variable, img, we could access the red value by:
print("Upper left has red:", img[0,0,0])
and the amount of green:
print("Upper left has green:", img[0,0,1])
and the amount of blue:
print("Upper left has blue:", img[0,0,2])
Any point can be accessed via its coordinates (i,j) and the color channel (0 for red, 1 for green, and 2 for blue).
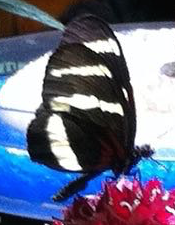
What does this code do? Work through it first, and then try on your computer. This program assumes that you have a file called bf1.png in the same directory. You can use that file, or substitute one of your own.
import matplotlib.pyplot as plt
import numpy as np
img = plt.imread('bf1.png')	#Read in image from bf1.png
plt.imshow(img)			#Load image into matplotlib
plt.show()
height = img.shape[0]
width = img.shape[1]
newImage = np.zeros((height,width,3))
for i in range(height):
	print("processing row", i)
	for j in range(width):
		newImage[i,j,0] = img[i,j,0]
		newImage[i,j,1] = 0
		newImage[i,j,2] = 0
plt.imshow(newImage)		#Open window to show image (close to continue)
plt.show()
plt.imsave('face2.png',newImage)
Challenges:
- How can you display only the green channel? How can you display the blue channel?
- Write a program that displays the image in black and white. Each color value of the pixels in the new image are an average of the red, green, and blue in the original. That is,
newR = (r+g+b)/3
newG = (r+g+b)/3
newB = (r+g+b)/3
- Write a program that shows only the pixels that are white (or very close-- that is, red, blue, and green values above 90%).
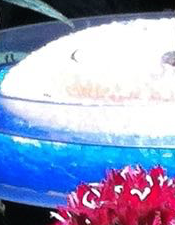
- Write a program that shows only pixels that differ between these two butterfly images, bf1.png and bf2.png. Modify your program to show the pixels in the first image that are similar (within 20%) of the second image.